Trading Ratios
Certain parts of this chapter will rely on your understanding of the
chapter Basic Structure.
This chapter is comprised of the topics listed below. Click on the desired
topic to move automatically to its corresponding description.
Characteristics
Open window
and access its Parameters
Content
Formulas
Date
Date
Scale
Months
for Income Statement
Adjust
by Corporate Action
Currency
Tolerance
Characteristics
: The trading ratios available on the system are results of calculations
performed on financial statement items, stock prices and corporate actions.
Example 1: The ratio P/E is calculated as follows: stock price divided
by earnings per share and earnings per share is the result of dividing
net income by the shares outstanding of the company (both financial statement
items).
Example 2: The market capitalization indicator is obtained by multiplying
the stock's closing price by the shares outstanding of the company.
Example 3: The Dividend per Share ratio is the sum of dividends paid
within a specified period.
Therefore, many of the points reviewed in our discussion of financial
statements, stock prices and corporate actions (characteristics, parameters,
etc.) are also applicable to the trading ratios.
To fully understand trading ratios in addition to reviewing the chapter Financial Ratios,
Stock Prices and Corporate Actions
we explore other details in this chapter.
Open window and access
its Parameters : To open the specific window for financial statements
consult the chapter Basic Structure >
Getting Started
You may change the settings of the financial ratios window according
to your specific needs.
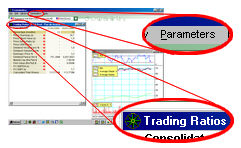 To change these settings choose Parameters
from the main menu bar. Please note the main menu bar is dynamic and some
of the options shown (including Parameters)
may relate specifically to the active window only (the window with the
title bar in blue). Therefore, before using any of the options in the
menu bar, it is important to activate the trading ratios window by clicking
anywhere within its window.
To change these settings choose Parameters
from the main menu bar. Please note the main menu bar is dynamic and some
of the options shown (including Parameters)
may relate specifically to the active window only (the window with the
title bar in blue). Therefore, before using any of the options in the
menu bar, it is important to activate the trading ratios window by clicking
anywhere within its window.
Content:
As discussed in the chapter Financial Statements,
the financial statement formats vary across countries and within each
country there are also industry specific formats (ind&com, banks,
insurance, etc.).Therefore, since the trading ratios are derived from
financial statement items the set of trading ratios for a given company
will depend upon the company's country and industry.
Example: The price to sales ratio (stock's closing price divided by
sales per share) will not be available for banks since the banking financial
statement format does not exhibit the line item Sales
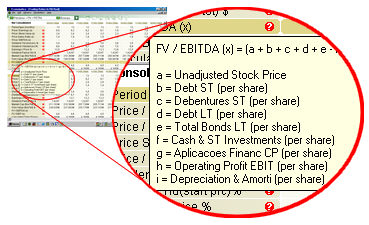 Fórmulas:
To consult the formulas for these ratios offered by the system, simply
open the Financial Ratios window
and click over the question-mark next to the ratio of interest.
Fórmulas:
To consult the formulas for these ratios offered by the system, simply
open the Financial Ratios window
and click over the question-mark next to the ratio of interest.
A yellow box will pop up with the description
of the formula respectively. Please note that as explained in the chapter
Financial Statements the financial
statement formats differ across countries. Therefore, a ratio may have
a certain formula for a company from a certain country and a different
formula for companies from another country. The interpretation of the
ratio would be the same however in both cases.
Date: The
system displays a historical daily series of trading ratios. In each day,
the system fetches the closing price of the day and the financial statement
item from the closest previous one available
Example: To calculate P/BV in Aug-18-2001, the system divides the closing
price of Aug-18-2001 by the book value per share of the financial statement
as of Jun-30-2001 (the closest previous one available).
Date
Scale: Although the default series of trading ratios is daily,
you may convert it as follows
Weeks:
Only data from every Friday would be displayed.
Months:
Only data from the last day of the month will be displayed
Quarters:
Only data from the last day of the quarter will be displayed
Years:
Only data from the last day of the year will be displayed.
Months
for Income Statement: This parameter affects those ratios which
use data items from the income statement (or cash flow statement / source
and use of funds statement). Although the system offers the options In fiscal year,
3 months and 12 months in
most cases the appropriate option to use is the 12 month option
Example: The principle behind the P/E ratio (stock's closing price divided
by earnings per share) is that the earnings considered should be for a
12 month period..
Adjust
by corporate actions: This parameter affects only the ratio Dividends Paid per Share. Events which
affect shares outstanding create a distortion in the Dividend
Paid per Share series.
Example: If a company pays the same amount of dividend every year but
its shares go through a stock split in which each old share is replaced
by ten new shares, the dividends paid per share is reduced by a tenth
of its original value prior to the split.
Therefore, it is necessary to adjust the values prior to the split to
keep the data comparable with the post-split data. Deselecting the option
Adjust by corporate actions will
display the original Dividends paid per
share in an unadjusted basis.
On the subject of corporate actions, it is worth noting that every trading
ratio involves in its calculation the total number of shares outstanding
of the company. This number is always adjusted by stock dividends, splits,
reversed-splits and capital reductions with Ex-dates between the financial
statement from which shares oustanding is extracted and the reference
date of the ratio. This adjustment is not optional and it is always performed
even if the parameter Adjust by Corporate
Action is not selected since otherwise the result would be incorrect.
Example: To calculate the ratio P/BV of Aug-18-2001, the system divides
the stock's closing price of Aug-18-2001 by the book value per share of
the Jun-30-2001 financial statement (the most recent available prior to
Aug-18-2001).
The book value per share is the result of dividing stockholder's equity
by total shares outstanding as of the Jun-30-2001 financial statement.
However, if there is a stock dividend, split, reversed split or capital
reduction with ex-date between Jun-30-2001 and Aug-18-2001, the shares
outstanding number used in the calculation of book value per share would
be adjusted by this corporate action.
To calculate market capitalization (and derivatives such as Enterprise
Value),the shares outstanding number is also adjusted (in addition to
stock dividends, splits, reversed splits, and capital reduction) by shares
issuances such as public offerings, rights issues, etc. with ex-date between
the financial statement from which shares outstanding is extracted and
the reference date of the market capitalization. This adjustment is not
optional and it is always performed even if the parameter Adjust
by Corporate Action is not selected since otherwise the result
would be incorrect.
Currency:
As we should expect this option affects ratios of monetary values such
as market capitalization, enterprise value, dividends paid per share,
etc.
In addition, ratios such as P/BV, P/E, etc, although not expressed in
monetary terms are also affected since the calculation involves monetary
components with different reference dates.
Example: The stock price of Aug-18-2001 is R$ 2.45 (brazilian reals)
and the book value per share of Jun-30-2001 is R$ 2.10. The P/BV would
be 1.17.
Performing the same calculation in US dollars yields a different result.
The exchange rate in Aug-18-2001 is R$ 2.52 (per 1 US dollar) and the
exchange rate in Jun-30-2001 is R$ 2.30 (per 1 US dollar). After the conversion
into US dollars of the stock price and the book value per share, we would
obtain a final P/BV of 1.06.
It is the decision of the analyst to choose whether to convert these
ratios into different currencies or not
Tolerance:
In addition to the description in chapter Stock
Prices > In Stock Guide columns, we'll add that in the case
of trading ratios this parameter will also determine the maximum distance
between the date of the ratio being calculated and the date of the previous
financial statement reported.