 The Risk X Return graph of the infinite posible portfolios
results in a solid figure as shown on the side.
The Risk X Return graph of the infinite posible portfolios
results in a solid figure as shown on the side.This chapter is comprised of the topics listed below. Click on the desired topic to move to its corresponding description.
The Efficient Frontier Concept
Click on the graph to see the composition of an optimal portfolio
View portfolio indices
View all elegible stocks or only those that comprised the portfolio
Portfolio weightings per sector or other variables
Save an optimized portfolio
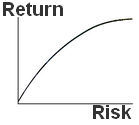
Efficient frontier concept: Given a set of stocks its posible to combine them in infinite ways to construct portfolios.
The portfolio’s expected return is the average return of all of its holdings’ expected returns (weighted average).
The portfolio risk is obtained by multiplying the weight matrix with the covariance matrix. The formula for this calculation is found in the chapter Portfolio Optimization > Formulas.
The Risk X Return graph of the infinite posible portfolios
results in a solid figure as shown on the side.
Naturally, every portfolio found enclosed by the solid curve (green region) should be discarded and only those portfolios in the frontier (blue line) should be considered as investment options. The rationale behind this is that for every portfolio in the interior region there will be at least one other portfolio which yields a higher expected return with less risk.
The portfolios on the frontier are called optimal portfolios.
 As described in the chapter Portfolio
Optimization > Elegible stocks > Return for the risk free asset,
the user may perform optimization that includes the risk free asset in
the portfolios. In such instances the efficient frontier takes the shape
illustrated to the side. The left-most portion of the curve intercepts
the Y-axis, and at this point the optimal portfolio is comprised by 100%
of the risk free asset.
As described in the chapter Portfolio
Optimization > Elegible stocks > Return for the risk free asset,
the user may perform optimization that includes the risk free asset in
the portfolios. In such instances the efficient frontier takes the shape
illustrated to the side. The left-most portion of the curve intercepts
the Y-axis, and at this point the optimal portfolio is comprised by 100%
of the risk free asset.
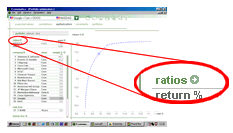
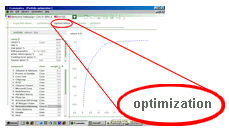 Click
on the graph to see the composition of an optimal portfolio: The
graph in the optimization window (adjacent image) shows the efficient
frontier associated with the set of stocks registered in the Expected
values screen.
Click
on the graph to see the composition of an optimal portfolio: The
graph in the optimization window (adjacent image) shows the efficient
frontier associated with the set of stocks registered in the Expected
values screen.
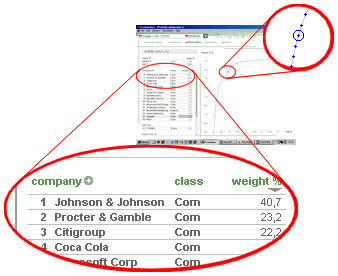 To visualize the portfolio composition of any point on
the frontier simply click on the desired point and the corresponding portfolio
composition will be displayed to the left side of the screen. The point
selected will be enclosed in a circle as illustrated on the side.
To visualize the portfolio composition of any point on
the frontier simply click on the desired point and the corresponding portfolio
composition will be displayed to the left side of the screen. The point
selected will be enclosed in a circle as illustrated on the side.
The chapter Portfolio Optimization > Graphical presentation discusses various tools available via the graphing function of the Optimization window.
 View
portfolio indices: In addition to viewing the portfolio’s composition,
various indices associated with the selected portfolio may also be displayed
(Sharpe, VAR, etc.). By clicking on the arrow as shown on the side, the
user will access the selection of all of the available indices on the
system. The indices selected by the user will be tabulated on the Optimization window
View
portfolio indices: In addition to viewing the portfolio’s composition,
various indices associated with the selected portfolio may also be displayed
(Sharpe, VAR, etc.). By clicking on the arrow as shown on the side, the
user will access the selection of all of the available indices on the
system. The indices selected by the user will be tabulated on the Optimization window
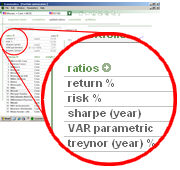 In the example on the side, the user has selected to see
the Sharpe, VAR and Treynor indices (in addition to return and risk).
In the example on the side, the user has selected to see
the Sharpe, VAR and Treynor indices (in addition to return and risk).
Consult the chapter Portfolio Optimization > Formulas to learn the calculation methodology behind these indices.
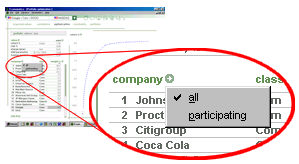 View
all elegible stocks or only those that comprised the portfolio:
By clicking on the arrow as shown on the side, the user may select to
view only the stocks that comprised the portfolio or every elegible stock
(those listed in the Expected
values window). In the latter
case the stocks that are not part of the portfolio will have a weight
of 0.
View
all elegible stocks or only those that comprised the portfolio:
By clicking on the arrow as shown on the side, the user may select to
view only the stocks that comprised the portfolio or every elegible stock
(those listed in the Expected
values window). In the latter
case the stocks that are not part of the portfolio will have a weight
of 0.
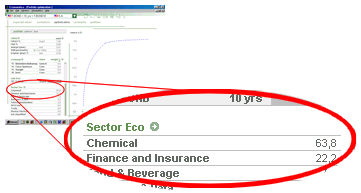 Portfolio
weightings per sector or other variables: Below the list of stocks
we find the sector breakdown and their respective weights in the portfolio.In
addition to the portfolio’s sector composition, it is also possible to
show the composition by other variables (debt level, dividend yield, etc).
Further explanation is available in the chapter Portfolio
Optimization > Sector composition and others.
Portfolio
weightings per sector or other variables: Below the list of stocks
we find the sector breakdown and their respective weights in the portfolio.In
addition to the portfolio’s sector composition, it is also possible to
show the composition by other variables (debt level, dividend yield, etc).
Further explanation is available in the chapter Portfolio
Optimization > Sector composition and others.
The chapter explains for instance how to select the variable Return over Equity and have the system display weights by different ranks of Return over Equity.
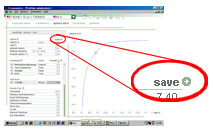 Save
an optimized portfolio: As described in the chapter Portfolio
Optimization > Portfolio construction, multiple portfolios may
be constructed and saved.
Save
an optimized portfolio: As described in the chapter Portfolio
Optimization > Portfolio construction, multiple portfolios may
be constructed and saved.
This tool allows the user to save his/her own portfolios (the actual portfolios of clients, etc) as well as the optimized portfolios generated by the system. To save an optimized portfolio, the user must click on the desired point of the frontier and immediately click on the arrow illustrated to the side.
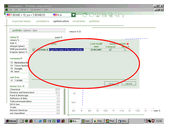 The next screen will prompt the user for a portfolio name.
The system will also automatically assign an identification letter to
the portfolio.
The next screen will prompt the user for a portfolio name.
The system will also automatically assign an identification letter to
the portfolio.
The user may also select how the system should update the portfolio composition in the future (Value $ or Number of Shares). Consult further details in the chapter Portfolio Optimization > Portfolio construction > How the system should update the portfolio composition in the future.