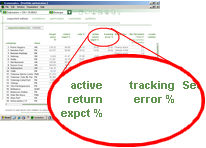
 As in the case of risk, the system calculates tracking
error for each individual stock and its shown in the Expected
values screen.
As in the case of risk, the system calculates tracking
error for each individual stock and its shown in the Expected
values screen.This chapter is comprised of the topics listed below. Click on the desired topic to move automatically to its corresponding description.
Introduction
Defining the benchmark and its respective expected return
Optimizing by Active Return X Tracking error
Introduction: Benchmark is an index selected by the user to represent the evolution of the market average. The S&P 500 and the Dow Jones Industrial Average are examples of benchmarks in the US market.
In previous chapters we have supposed that the user’s objective has been to maximize absolute return and minimize risk but there are fund managers who might instead choose to maximize the return above the market average, i.e., above a certain benchmark irrespective of absolute return.
The return above a given benchmark is known as the active return.
For instance, such fund managers would be pleased to achieve a negative 5% absolute return during a period in which the benchmark has fallen by 15%, in effect this would yield a positive active return of 11.7%. On the other hand it would be a disappointment to achieve an absolute return of 60% during a period in which the benchmark was up 70% since this would yield an active return of negative 5.9%.
Any time the objective is to beat the benchmark the best portfolios are not those with the smallest risk but rather those with the smallest risk relative to the benchmark, i.e., those that accompany closest the benchmark. Tracking error is the name given to the measure of risk relative to the benchmark. The formula to calculate tracking error is found in the chapter Portfolio Optimization > Formulas.
As in the case of risk, the system calculates tracking
error for each individual stock and its shown in the Expected
values screen.
When the object is to find those portfolios that can beat the benchmark it becomes necessary to determine each stocks’ expected active return (above the benchmark) and not their absolute expected return.
The user will not have to input the expected active return for each stock, but rather input the expected return of the benchmark and in turn the system will calculate Active return for each stock by employing the individual stock’s absolute returns previously entered by the user.
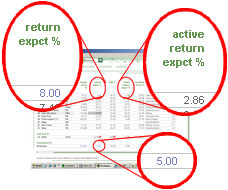 In the adjacent example the user entered an absolute expected
return of 8% for the stock and 5% for the benchmark. The system then calculates
an expected active return of 2.86% (= 1.08 /
1.05).
In the adjacent example the user entered an absolute expected
return of 8% for the stock and 5% for the benchmark. The system then calculates
an expected active return of 2.86% (= 1.08 /
1.05).
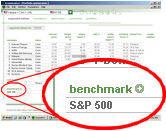 Defining
the benchmark and its respective expected return: The benchmark
is found in the Expected values screen
below the list of stocks and the risk free asset (adjacent image).
Defining
the benchmark and its respective expected return: The benchmark
is found in the Expected values screen
below the list of stocks and the risk free asset (adjacent image).
The benchmark initially offered by the system may be changed. The system offers the S&P 500 index as a benchmark in the US, but the user may change it for the DJIA for example. To select a new benchmark the user should click on the arrow next to Benchmark and in the popup window choose the preferred benchmark.
The expected return of the benchmark may be specified manually by the user or generated automatically using the historical average of the index. The user determines the benchmark’s expected return the same way as the determination of the expected returns of the individual stocks, consult the chapter Portfolio Optimization > Elegible stocks > Expected return.
Optimizing by Active Return X Tracking error : Once the active return and tracking error of each stock has been established, it is then possible to find an efficient frontier using this pair of variables.
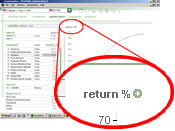 This frontier will also be presented in the graph of the
Optimization screen. To substitute
the default frontier (risk X return) with the new frontier the user must
click on the arrow next to Return
as indicated
in the adjacent image.
This frontier will also be presented in the graph of the
Optimization screen. To substitute
the default frontier (risk X return) with the new frontier the user must
click on the arrow next to Return
as indicated
in the adjacent image.
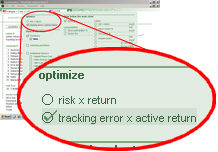 ... and in the next screen click on the option as shown
to the side
... and in the next screen click on the option as shown
to the side
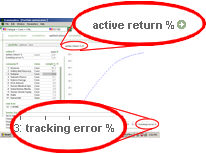 The axis of this graph now become active return and tracking
error as can be seen in the adjacent image.
The axis of this graph now become active return and tracking
error as can be seen in the adjacent image.
The chapters Portfolio optimization > Efficient frontier and Portfolio optimization > Optimization describe the functionality of the Optimization screen with respect to risk X return. The complete functionality described in those chapters is just as applicable to the user optimizing by active return X tracking error.